02
Strategic
Global context
The convergence of crises, dominated by COVID-19, climate change, and conflicts, has created a major setback on the road towards the SDGs.
The UN SDGs Report 2022 highlights the reversal of years of progress in eradicating poverty and hunger, improving health and education and providing basic services, as a consequence of the recent global disruptions (UN, 2022).
The 2022 Financing for Sustainable Development Report (UN, 2022) further identifies a “great finance divide” with low-income countries at risk of debt distress, limited fiscal space and hampered economic growth.
The combination of crises has reversed years of progress in reducing poverty and ending hunger.
In 2022, the world had an additional 75 million to 95 million people living in extreme poverty (World Bank, 2022) and up to 205 million people faced acute food insecurity and were in need of urgent assistance in 45 countries (WFP, 2022).
Member countries progress towards the SDGs
Halfway towards the 2030 development Agenda roadmap, the international community need to step up their efforts in order to attain the 2030 SDG goals and targets.
OIC Member Countries overall SDG Index score stands at 62.2, suggesting that member countries are slightly over sixty percent to achieving the 17 SDGs.
Despite high achievement on some goals, such as Goal 12 (Responsible Consumption and Production) and Goal 13 (Climate Action), major challenges remain with regards to Goal 9 (Industry, Innovation and Infrastructure), Goal 5 (Gender Equality) and Goal 11 (Sustainable Cities and Communities)(IsDB Institute, 2022).
The positioning of trade across the 2030 Agenda shows that trade, when well-regulated, can contribute to exponential growth and sustainable development. ITFC is fully committed to the SDGs. Our contribution goes to those areas where we can achieve the highest impact: energy, agriculture, private sector development, and health. These sectors are fundamental to our member countries growth and shared prosperity.
Tier I - Results
Sustainable Development Goals
SDG Sub-indicator
Results (year)

SDG 1
No poverty
Proportion of population below the international poverty line of US$1.90 a day
SDG Sub-indicator
1.1.1
Results (year)
9.2 (2020)

SDG 2
Zero hunger
Prevalence of food insecurity (SDG 2.1.2)
SDG Sub-indicator2.1.2
Results (year)33 (2020)

SDG 7
Affordable and Clean Energy
Proportion of population with access to electricity (SDG 7.1.1)
SDG Sub-indicator7.1.1
Results (year)90.5 (2020)

SDG 8
Decent work and economic growth
Aid for Trade commitments and disbursements (SDG 8.a.1) (Millions of constant 2020 USD)
SDG Sub-indicator8.a.1
Results (year)55,780.2 (2020)

SDG 9
Industry, Innovation and Infrastructure
Proportion of small-scale industries with a loan or line of credit (SDG 9.3.2)
SDG Sub-indicator9.3.2
Results (year)29.8 (2021)

SDG 17
Partnerships for the Goals
Additional financial resources mobilized for developing countries from multiple sources (Millions of USD)
SDG Sub-indicator17.3.1
Results (year)998,891.4 (2020)
Source: UNSD
strategic context
Intra-OIC trade
Despite significant progress over the last decade, the share of Intra-OIC has stagnated over the last three years. Further efforts need to be exerted in order to reach the 25 per cent target set out in the OIC Ten-Year Programme of Action (OIC 2025).
The share of Intra-OIC trade between member countries reached 19% in 2021, slightly below the 19.5% registered in 2020, but way below the 21% recorded in 2018.
In terms of volume, Intra-OIC trade figures bounced back from the deep, COVID-19-induced slump as they reached US$736 billion in 2021, a 28% increase from the previous year.


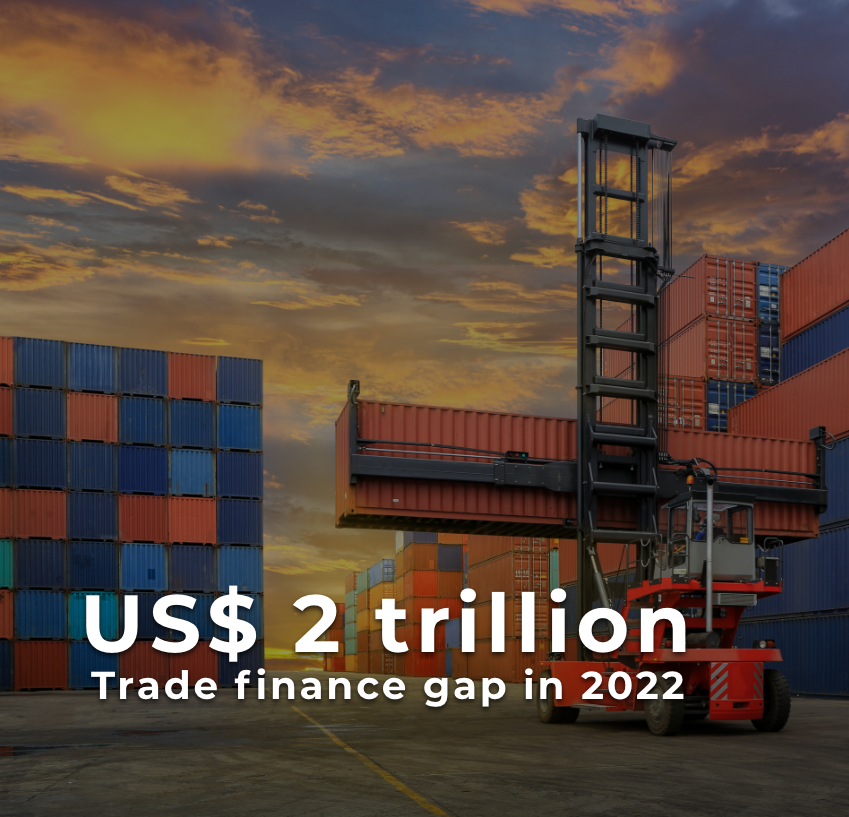
Trade Finance Gap
The global trade finance gap values have been persistently large over the years and grew to an all-time high of USD$ 2 trillion in 2022 ( ADB, 2021 ).
The Asian Development Bank estimated that the trade finance gap reached at least USD$ 2 trillion in 2022 as the trade finance market continued to suffer from global political, economic and financial uncertainties. Over the last years, the trade finance gap has historically represented around 7%–10% of global merchandise export values.

Total Islamic Finance
Assets in 2021
US$ 4.0
trillion

Growth of if
assets in 2021
17%

Total if
institutions
1,679
Source: IFSB 2022
Islamic Finance
Amid the impact of the COVID-19 pandemic, Islamic Finance has continued to report remarkable growth.
The Islamic Finance sector has reported double-digit growth in both asset volumes and financing over the past five years. The positive momentum continued in 2021, with the industry recording a growth rate of 10.7 per cent year-on-year, driven primarily by increased demand for Islamic banking services as well as equity and capital markets.
The Islamic Financial Services Board's (IFSB's) Stability Report 2022 noted that “amid a possible resurgence in COVID-19 and a prolonged conflict in Ukraine, the global Islamic financial services industry (IFSI) is expected to remain resilient.
Tier II - Results
Strategic Context
Strategic objective
Indicator
Source
Baseline (2016)
Results (2021)
YoY trend
SO1: Intra-OIC
trade
| Indicator | Source | Baseline (2016) | Results (2021) | YoY trend | |
|---|---|---|---|---|---|
|
Share of |
ICDT | 18.8 | 19.04 |
SO2: Islamic
Trade Finance
| Indicator | Source | Baseline (2016) | Results (2021) | YoY trend | |
|---|---|---|---|---|---|
|
Trade Finance Gap |
ADB | 1,6 | 2 | ||
|
Islamic Banking assets |
IFSB | 1,4 | 2.1 |
SO3: Diversification of
MC economies
| Indicator | Source | Baseline (2016) | Results (2021) | YoY trend | |
|---|---|---|---|---|---|
|
Share of the manufacturing industry in total value added of OIC countries |
SESRIC | --- | 15.2 |
on track
on watch
off track